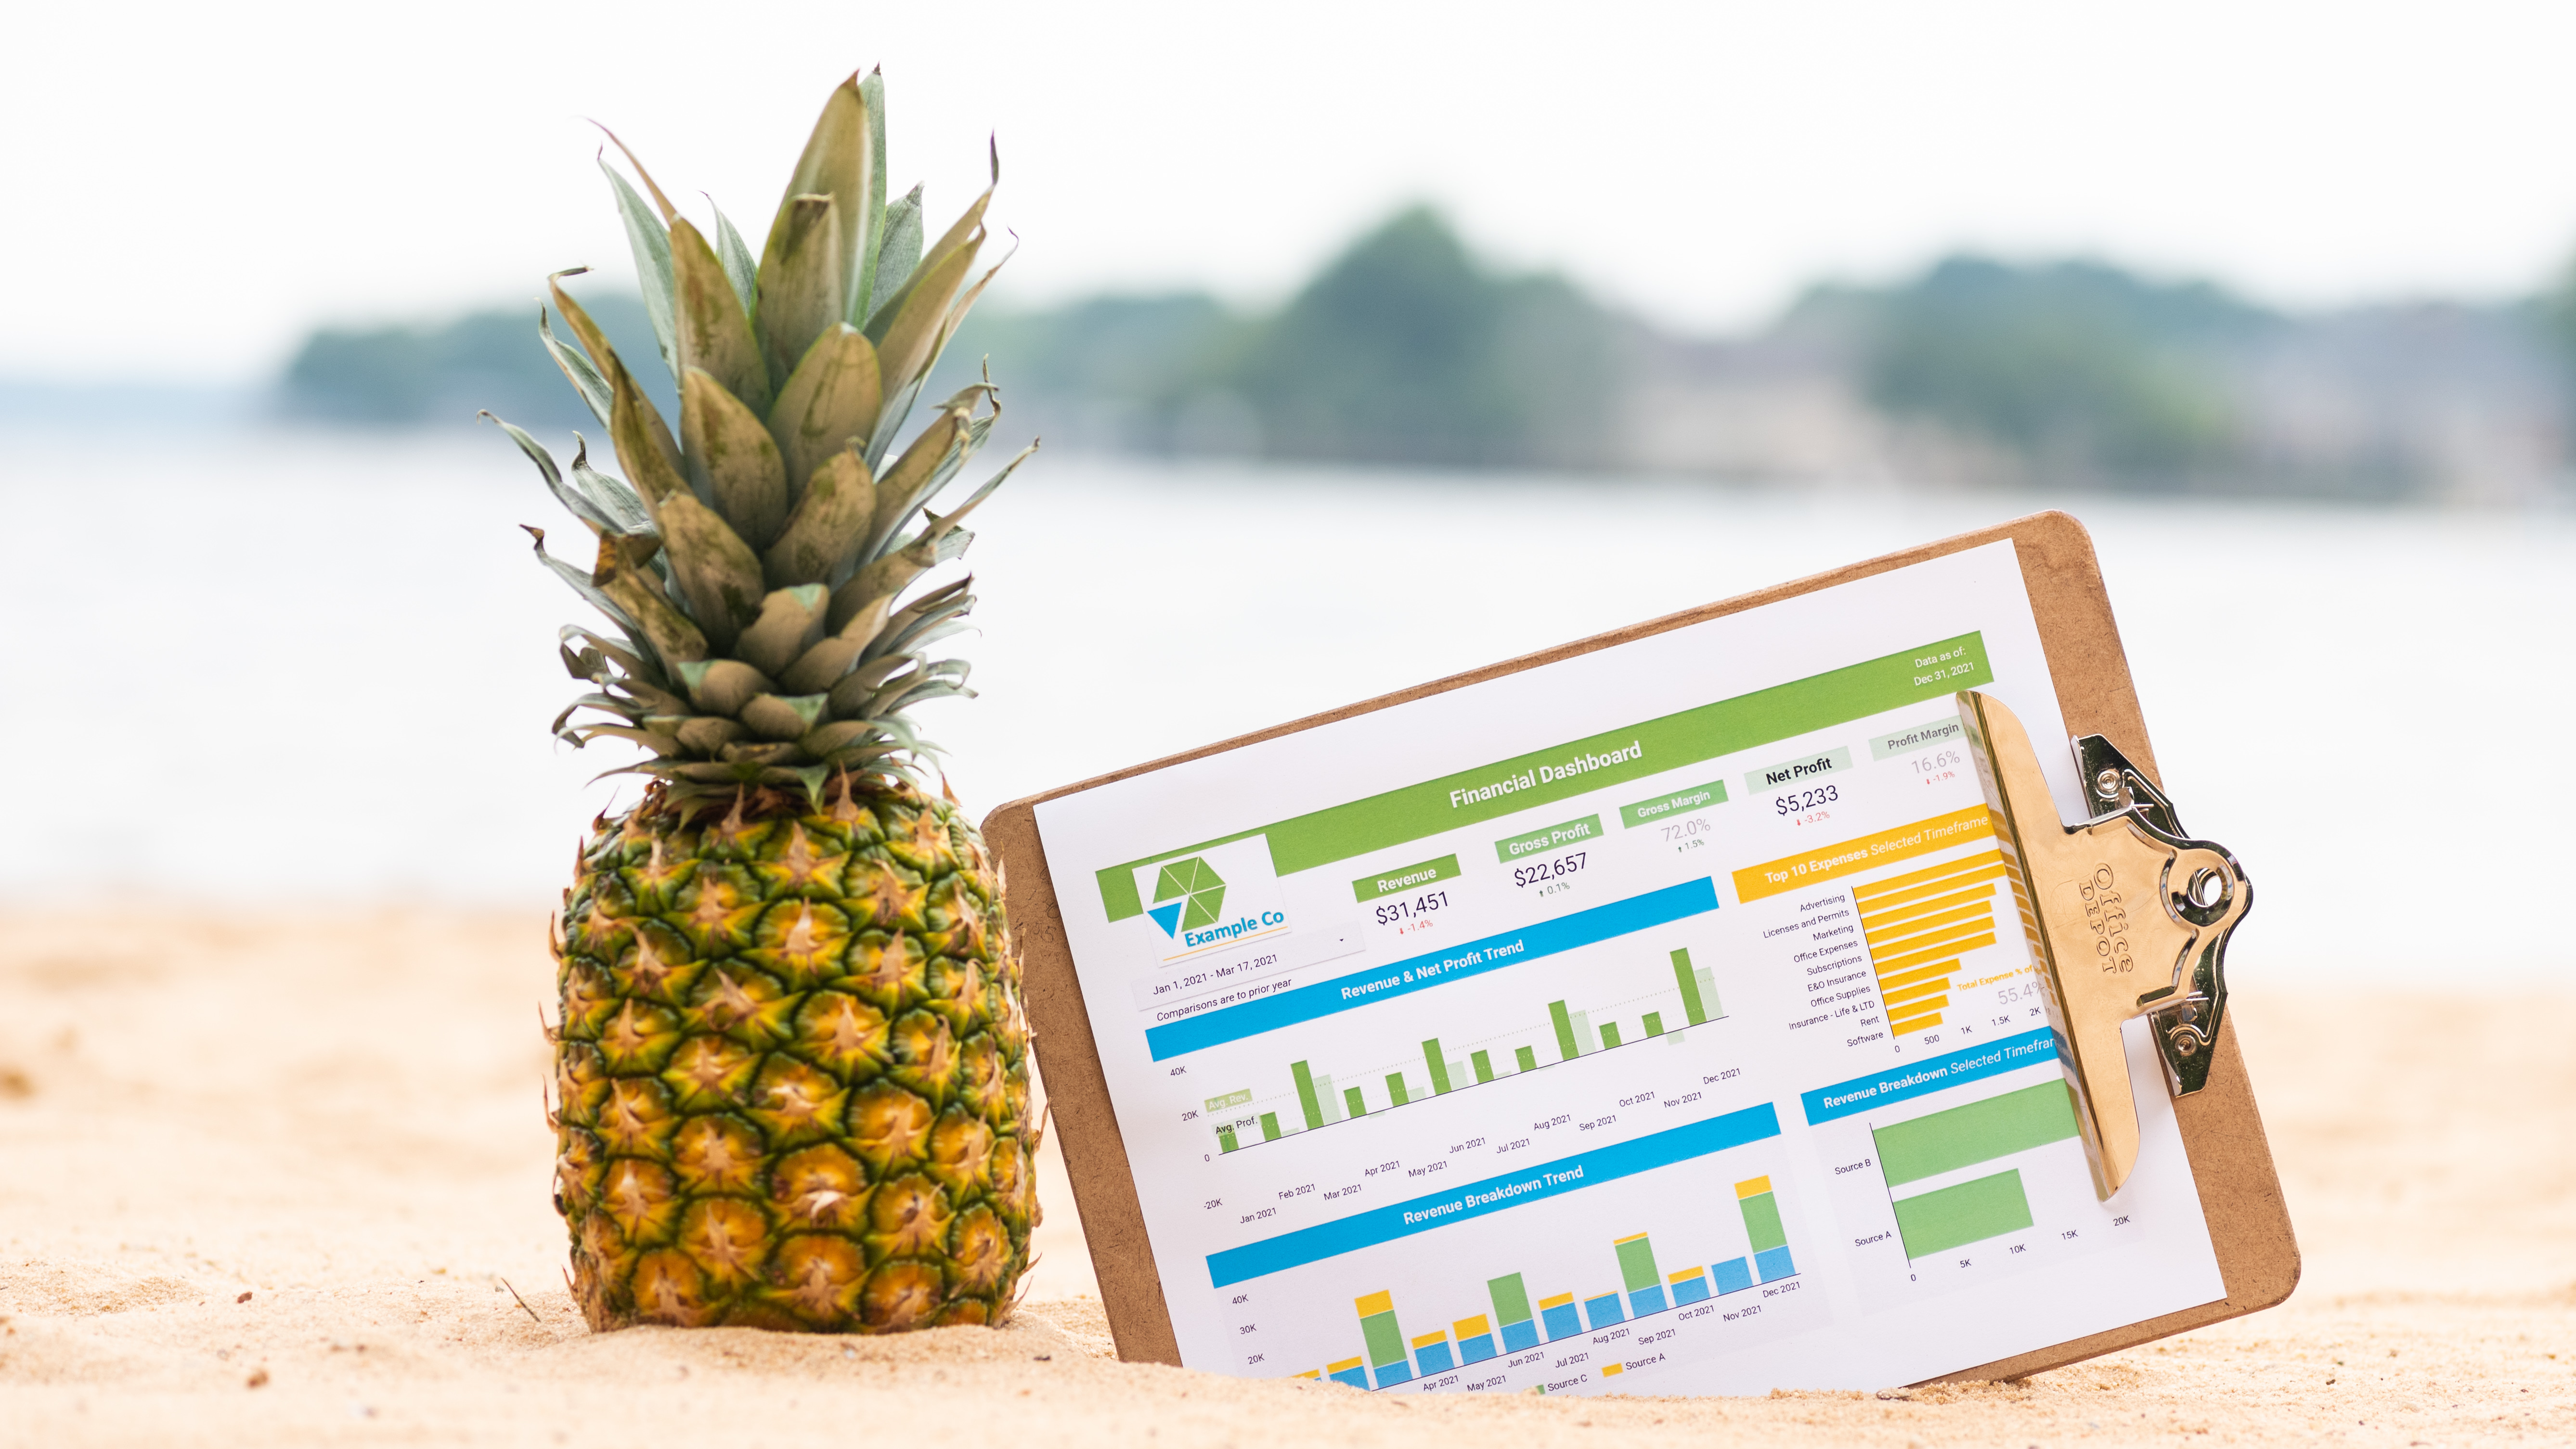
White-label AI dashboards for accounting firms
Your data. Our expertise. Free to try.
We spent 6+ years building 1,000+ dashboards by hand, then trained an AI on everything we learned. Now your firm gets our expert-trained AI dashboard builder, insights for advisory conversations, and customizing is one prompt away. Roll it out to your whole client base in <5 mins.
For strategic advisors, by strategic advisors.
Done-for-you in one call · We build it live on your QuickBooks and you keep it · Roll it out with margin.
The revenue math
Giving every client a live dashboard and their own AI analyst changes what you can charge, how many clients you can carry, and how long they stay. Here's exactly where the growth comes from - and a calculator so you can check it against your own client base.

The fastest lever, because it needs no new logos and no new sales calls. A rate conversation is hard when you're delivering the same report you delivered last month. It's a lot easier when the client has a live dashboard built around what their business actually cares about - because you described it in a sentence, not because they got the same template as everyone else.
Most firms sell one thing. Now you can sell three - your core service alone, your service plus the dashboard and AI analyst, or all of it plus your advisory. That middle tier is where price-sensitive clients land instead of churning. And at the top, load their forecast in alongside actuals - budget-vs-actual with an AI that explains the variance is a real advisory deliverable, and it's a prompt, not a project.
The reporting builds itself and refreshes daily. No pulling exports, no rebuilding the same deck twelve times, no two hours of prep before every client call. Even the custom work isn't work - you don't build a dashboard, you ask for one. That reclaimed capacity is the difference between growing your client count and growing your payroll.
A monthly PDF report is replaceable. The advisor who caught the $3,200/mo subscription nobody had reviewed is not - especially when they turn that $3,200 into a high ROI opportunity. The dashboard puts those catches in front of you every month, and the client sees you finding them. Retention isn't in the calculator below - it quietly multiplies every line in it.
Every input below is a slider you can move. Change the adoption split, the uplift per tier, or how many hours a new client actually costs you to serve - nothing is locked inside a fixed multiplier.

Start here - your current client count and average fee.
This is an illustrative model built from the assumptions listed above, not a guarantee of results. Your numbers will depend on your client mix, how you package the offer, and how efficiently freed-up hours convert into new client capacity. Retention is deliberately left out of the math - it lengthens the lifetime value of every line above.
Customizable by default
White-label comes standard here, not as an upcharge. So does customization. If the default view isn't what a client needs, you describe what you want and it builds it. No BI tool, no support ticket, no implementation call.

A page built around one client's unit economics. A view that ignores three accounts they never look at. Their forecast next to actuals with variance called out. Plain English in, live dashboard out. Build a view once and reuse it across every client it fits.
Your logo, your colors, your firm's name front and center. Competitors sell white-label as a paid add-on or a higher tier. Here it's how the product ships. Your clients never see our name anywhere.
Your client asks why margin slipped last quarter. You ask it anything you want ten minutes before you walk into their meeting. Every competitor generates commentary at the client and stops - output you still have to package and deliver yourself.
Custom for every client, built in minutes
Advisors here don't build anything. They prompt.
Every view on this page started as a sentence. Describe what a client needs, roll it out to your whole client base, and spend the time you get back in front of clients. We'll build your first one live on your data, free.
Get a free dashboard on your dataPineapple Analyst vs. AI chat
AI chat tools like Claude and ChatGPT are great at a one-off dashboard for internal use - after a lot of guidance, a few pasted exports, and plenty of back-and-forth. Pineapple Analyst is everything around the dashboard: the data pipeline, the customization, the scale, the speed, and the place your clients log in to see it.
One dashboard at a time. Done well, but not expert-level, and not scalable.
Custom dashboards for every client, fully automated.
Data pipeline
The ETL
Customization
That sticks
Scalability
Across your client base
Speed
From connect to live
Publishing
What your client sees
Keep using Claude. It's the best thinking partner you've had for a one-off question or an internal analysis. Pineapple Analyst is what turns that kind of insight into a product every client logs into, under your name, every month.
AI chat builds a dashboard. We build the system that delivers it to every client.
See it running on your client baseWhat firms are saying
We've run a fractional analyst firm since 2020, so we only grow when your firm does. You get direct access to our team, not just a help desk, and we'll take on ongoing analysis for your firm or your clients whenever you need it.
We've been partnering with Pineapple for a couple of years now and it's been a game-changer for our business and our clients. Highly recommend!
Brad
Sourced Bookkeeping & Consulting
Working with Pineapple has been an outstanding experience. The dashboards they've created for us have significantly enhanced our reporting capabilities and delivered tremendous value to our clients. Their team feels like a true partner!
Elizabeth
Nexagy CFO
If you have any reporting needs that you're struggling to create internally, don't walk, run to have a conversation with Pineapple. We couldn't be happier. The project was on time and on budget with clear communication through the process.
Broc
Pair PEO
What is Pineapple Analyst?
The unified intelligence layer for accounting firms and the advisors who serve their clients.
Your clients' financials, pipeline, and operations live in different tools and tell disconnected stories - and you're looking at them one client login at a time. We bring it all together: your whole client base on one screen, a branded dashboard per client, and one AI analyst that explains any of it.
We handle the technical side: connecting data sources, building dashboards, deploying an AI analyst your clients can actually talk to. And when a client needs something different, you describe it in plain English instead of building it - then roll it out to every client it fits in under 5 minutes.
Your brand is on it. You get the credit. Live in under 5 minutes, not weeks.
Who it's for
Pineapple Analyst is designed for accounting and bookkeeping firms carrying 50 to 200 clients - and for the advisors who want to be AI-forward with those clients without needing AI expertise.
50-200 clients
See your entire client base on one screen. Build a dashboard once and roll it out to all 150 of them in under 5 minutes - instead of pulling the same number one login at a time.
Learn more →50-200 clients
A 100-client base means 100 separate logins every month. Give all of them a live branded dashboard and their own AI analyst - without adding prep hours or headcount.
Learn more →Deliver real-time financial dashboards and an AI analyst to every client - under your brand, in under 5 minutes.
Learn more →Show marketing ROI, pipeline performance, and campaign impact in a single branded dashboard your clients check daily.
Learn more →Why firms choose us
White-glove onboarding - one investment, your whole client base
You can start free and set it up yourself. Most firms don't. We build the platform to your firm's specs - your dashboards, your KPIs, your brand, the connectors you need - train your team, and roll your clients out in chunks. The onboarding investment covers every client you have today and every client you add later. It isn't charged per client, and it isn't charged again when your client base grows.
Your whole client base on one screen
Every connected client rolls up into a single consolidated view - sortable, filterable, always current. Sort by cash runway or AR aging and see who needs a call this week, or just ask the AI across the whole client base. No more opening ten client files to find the same number ten times.
Fully customizable - you prompt, you don't build
Every competitor ships you a fixed template and calls it a product. Here the template is a starting point. Describe the page, the metric set, or the forecast view you want and it gets built - no BI tool, no ticket, no waiting on us. Build a view once and roll it out to every client it fits in under 5 minutes.
Clients get an analyst, not just a dashboard
Your clients ask questions and get instant, data-backed answers in plain English. And it runs both directions - you can ask it anything ten minutes before their meeting. Nobody else lets clients chat with the AI at all.
Increase value and revenue per client
Move from reporting what happened to advising on what to do next. Raise rates on existing clients, open a new tier, and carry more clients on the same hours. Bundle it in and charge a margin on top - this is a revenue generator, not a cost you eat.
Your clients' data is disconnected. You can fix that.
Every tool your client uses tells a different story. QuickBooks shows what happened. HubSpot shows pipeline. Their forecast sits in a spreadsheet. You're the one who connects the dots - and now you have a platform that does it automatically.
Speed is built into the data model
Every competing product has an implementation phase - chart of accounts mapping, training sessions, onboarding calls. We load a client in under 5 minutes and the dashboards update themselves. That speed isn't a feature - it's how the business model works.
A partner, not a software vendor
We've been a fractional analyst firm since 2020, and we run the platform the way we run client work: relationship first, with our growth tied to yours. You get an AI support agent for quick questions and direct access to our team for everything else - plus ongoing analysis for your firm or your clients whenever you want it.
Pineapple Analyst vs. the alternatives
QuickBooks' AI is scoped to the client file you're logged into. BI tools make you build every dashboard by hand. FP&A platforms are priced and architected around a single company's planning cycle. AI chat with a QuickBooks connector lives inside your own session. Here's how each one handles the work a firm actually does.
What a firm needs |
Built for a whole firm
Pineapple Analyst
Built for accounting firms and advisors
|
QuickBooks AI Built into the client file |
Tableau / Power BI / Looker Studio General-purpose BI tools |
FP&A platforms Planning and forecasting suites |
AI chat + QuickBooks A connector inside your own session |
|---|---|---|---|---|---|
| See your whole client base on one screen | Every connected client in one consolidated view - sort, filter, and rank in seconds | One client file at a time - scoped to whoever you're logged in as | Possible, but you build and maintain the model for every client yourself | Priced and architected around one company, not a portfolio | One connected file per session, nothing that rolls up |
| Get a new client live | Under 5 minutes - or we roll your whole client base out for you | Already there, but there's nothing to hand the client | Days to weeks - account mapping, template config, training | Weeks - model build, mapping, usually a paid implementation consultant | Fast for a single chat, but nothing that can be handed to a client |
| Build a view once and reuse it across the client base | Describe it in plain English, then roll it out to every client it fits | Nothing to roll out - answers live inside a single file | Every chart built by hand, then rebuilt again for the next client | Template changes route through their team or a change request | Output is a chat reply, not a view you can publish or reuse |
| Give each client their own portal | A live portal per client, with Admin and Viewer roles you control | Not possible - built for you, not for your client | No native way to spin up a client view - each one is a manual rebuild | Built for one company's finance team, not a portfolio of clients | Not possible - output only lives inside your session |
| Let your client ask their own questions | Your client gets their own AI analyst - and so do you, before every call | No - the client never sees it | No conversational layer - clients only see the report they're sent | Clients receive output, they don't explore it | You can ask. Your client can't |
| Go beyond what's in the books | HubSpot pipeline, Google Sheets forecasts, and other connected sources alongside the books | QuickBooks data only - no pipeline, no operational context | Yes, if you build every join and relationship by hand | Finance-first - other sources are out of scope or a custom project | One connected source at a time |
| Keep your firm's brand in front of the client | Fully white-labeled, included at every tier | Intuit's brand, not your firm's | Limited - clients see the tool's own login and chrome | Rarely white-labeled, and an enterprise add-on when it is | Clients would see the AI vendor's brand, not yours |
| Do it without hiring a data person | Connect the data, or hand us the list and we set it up for you | Yes - it's just limited to one client file | Not really - real modeling and query skills are required | Requires modeling skill and ongoing upkeep of the plan structure | Easy to chat with, but making it client-facing takes real engineering |
Scroll the table sideways to compare →
None of these are bad tools. QuickBooks' AI is strong for a single business owner looking at their own books. BI platforms are excellent for deep, custom analysis in expert hands. FP&A platforms are serious planning tools for one finance team. AI chat with a live connector is a genuinely useful personal workflow. They were all built for someone running one company - and you're serving a client base full of them.
FAQ
Everything you need to know before getting started.
Pineapple Analyst is the unified intelligence layer for accounting firms and the advisors who serve their clients. Your clients' financials live in QuickBooks, their pipeline in HubSpot, their forecast in a spreadsheet - and you're looking at all of it one client login at a time. We connect it into one place, give you your whole client base on a single screen, build a branded dashboard for every client automatically, and deploy an AI analyst your clients can actually talk to. You get the credit, in minutes rather than weeks.
Either way works, and most firms choose to have us do it. The free trial is genuinely free - connect a client, see it live, no card required. But if you're carrying a real client base, the value isn't one dashboard, it's a platform built the way your firm actually reports. With white-glove onboarding we build it to your specs, create the connectors and views you need, train your team, and roll your clients out in chunks. The onboarding investment is one time and it covers your entire client base - every client you have today and every client you add later. It isn't charged per client, and it isn't charged again when your client base grows. Book 30 minutes and we'll scope it against your actual client list.
Four levers. You can raise rates on existing clients, because a live custom dashboard is a different deliverable than a monthly report. You can open a middle tier for price-sensitive clients instead of discounting. You can carry more clients on the same hours, since the reporting builds itself. And clients who log in every week stay longer. Run the numbers against your own client base with the calculator higher up this page - every assumption is visible and editable.
Fully customizable, and it's the part no competitor matches. The templates are a starting point, not a ceiling. Want a page built around a client's unit economics, a view that ignores three accounts they never look at, or their forecast sitting alongside actuals with variance flagged? Describe it in plain English and it gets built - then roll it out to every client it fits. You aren't learning a BI tool or waiting on us, and you aren't rebuilding the same view client by client.
Under 5 minutes per client. Connect their data source and the dashboard plus AI analyst are built and live - no configuration, no chart-of-accounts mapping, no weeks-long implementation. Rolling out your whole client base is an afternoon, not a quarter - and with white-glove onboarding, we do that rollout with you in chunks rather than handing you a list. Customizing a view afterward is a sentence, not a project.
Fair question, and the right one to ask. The AI analyst answers from your client's connected data only - it isn't guessing from general knowledge or inventing figures from outside their books. It's built to handle the routine "what happened and why" questions, not to replace your judgment on anything that matters. You control what's published, you see the same dashboard your client sees, and you're still the one in the room for the real decisions.
QuickBooks Online and HubSpot are live out of the box, and Google Sheets, Excel and CSV are live too - which matters more than it sounds. Anything a client can export, you can connect, so forecasts, budgets, and one-off operational data get into the same dashboard as the books without waiting on anyone. When you connect Google Sheets, Pineapple Analyst reads only the spreadsheets you choose, read-only, to build your dashboards and reports. We never change your files or use your data to train AI. Xero is on the roadmap and available on request - if part or all of your client base runs on Xero, tell us on your scoping call and we build it into your onboarding rather than making you wait. Same for any other source your clients use: if it has an API, it's buildable, we quote it upfront as a fixed price, and once it's built it's available for every client on your account at no extra monthly cost. Ad platforms like GA4, Google Ads and Meta aren't live yet.
Accounting and bookkeeping firms carrying roughly 50 to 200 clients, first and foremost - firms big enough that a per-client platform is worth deploying, and already trying to move up the value chain from reporting to advisory. It also fits fractional CFOs, fractional CMOs and other fractional executives who deliver analytics as part of their client engagements. In all cases it gives you enterprise-grade analytics infrastructure you can deploy across a client base without a data engineering team or a months-long setup process.
A natural language interface built into every client dashboard, and it works in both directions. Your client can ask questions about their business in plain English - "What drove the revenue dip in March?" or "Which customers are most at risk of churning?" - and get instant, data-backed answers. You can use the same analyst to prep before a client meeting, or to ask a question across your entire client base at once: "which clients are under three months of runway" returns a ranked answer instead of ten separate client files.
QuickBooks' AI is genuinely good, but it's scoped to whichever single client file you're logged into - there's no way to compare across your client base, and nothing you can hand a client as their own portal. BI tools like Tableau, Power BI, and Looker Studio are built for one analyst to build and maintain reports by hand, with no native way to publish a branded dashboard per client. FP&A platforms are architected and priced around a single company's planning cycle, not a portfolio of clients, and are rarely white-labeled. AI chat with a QuickBooks connector is a great personal workflow, but the output lives in your session - there's no way to publish it, combine sources, or let your client ask their own follow-ups. Every one of them was built for someone running one company. Pineapple Analyst is built for someone serving a client base full of them.
No. The client-facing interface is designed for business owners and operators, not data analysts. Clients can explore dashboards visually or ask the AI Analyst questions directly in plain language. No SQL, no pivot tables, no training required.
Yes, and it's included at every tier rather than sold as an add-on. Your logo, your colors, your firm's name. Your clients experience a polished analytics product you delivered to them, not a third-party tool they were handed a login to. They never see our name.
The subscription is per client on a sliding scale, and the per-client rate drops as you add more - so the bigger your client base, the lower your rate, going as low as $39/mo per client. Plans start with a 14-day free trial and no credit card required. If you go the white-glove route there's a one-time onboarding investment on top, quoted upfront, that covers your whole client base rather than being charged per client. See full pricing details, or start free and look around first.
Yes. Data is encrypted in transit and at rest, each client gets their own isolated data warehouse, and tenant isolation is enforced at three independent layers. Your data is never used to train AI models. Full detail - encryption, isolation architecture, what is and isn't sent to the AI, and retention - is on our security page.
We've written up exactly how data is stored, encrypted, isolated between clients, and handled by the AI - in plain language, not marketing copy. Worth five minutes before you connect a client.
Your data. Our expertise. Free to try.
Book 30 minutes and we'll build a custom, branded dashboard live on your QuickBooks - and you keep it. Or start free and look around first; there's a demo client pre-loaded if you'd rather not connect a real one yet.
Limited Done-for-you availability · 14-day free trial, no credit card · White-label included